 Dexscreener
 connects token searches with pair charts and trading activity
Dexscreener tracks decentralized exchange markets so you can find token pairs and examine their price charts and trading activity. A pair represents a market between two assets, usually through a liquidity pool. Search identifies the market; charts and transaction data describe its activity. Screeners help discover other pairs, while watchlists and alerts support ongoing monitoring. The useful starting details are the token address, its network, and the particular pool you want to examine.
Finding a pair when the token identity is incomplete
Finding the intended market requires enough information to distinguish its token from unrelated assets using the same name. Search accepts a token name, symbol, token address, or pair address. An address provides a more precise starting point than a symbol alone.
Consider a hypothetical search: you want to examine a particular token, but initially have only its symbol. The available identifiers and search outcomes in this example are hypothetical; no token, network, or price is assumed.
In this hypothetical search, you obtain the intended token address and network before choosing a result. Searching that address returns a matching market. You compare its token address and network, then identify the quote asset and pool. You reach a pair page whose identity matches the asset you intended to investigate.
If the symbol instead returns several candidates and you still lack the intended address, you cannot yet identify the correct token. A familiar logo or prominent ranking does not resolve that missing identity. Find the intended token address before choosing a chart.
If the exact address produces no matching market, stop short of substituting another token. A missing result leaves availability unresolved. Continue only when the intended asset and a tracked pair can be matched.
The relationship between a token, its pool, and its chart
A token can participate in several pools, so a token name alone does not identify one trading history. The surrounding identifiers explain which market the displayed figures describe.
Token and pair addresses
The token address identifies an asset on its network. The pair address identifies the particular pool or market record. Base and quote tokens describe the assets in that pair. Keeping these distinctions intact matters when comparing search results: two rows can involve the same token while representing different pools. The API exposes these identifiers separately.
Blockchain activity and displayed analytics
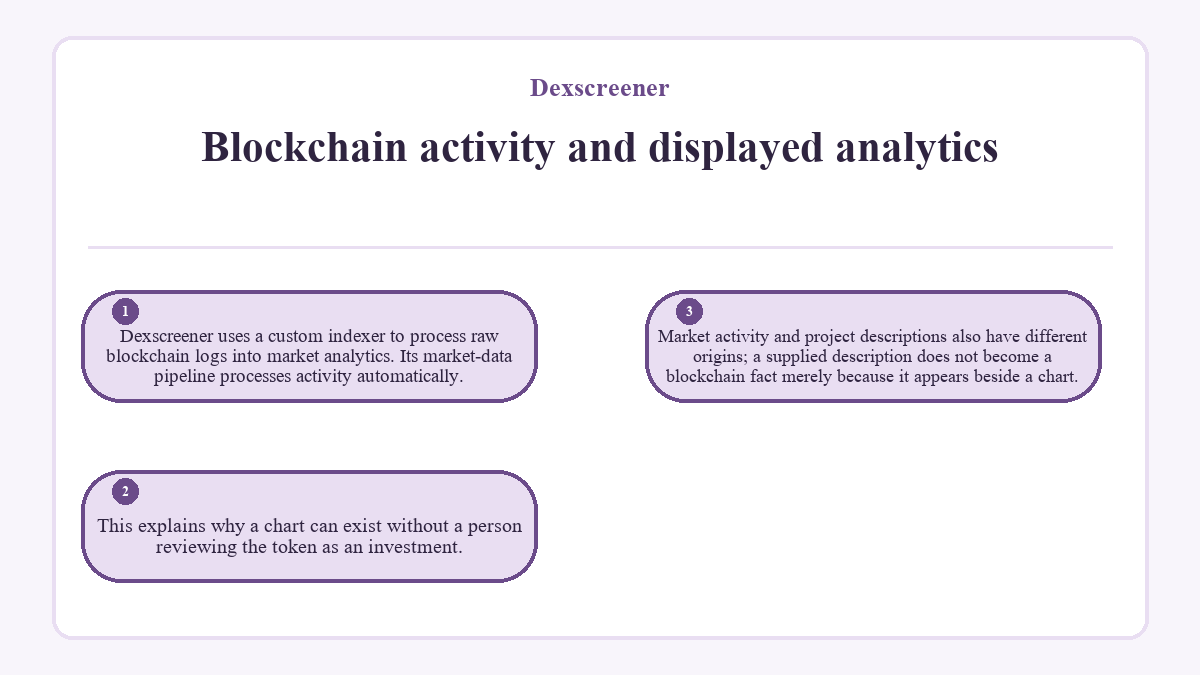
Dexscreener uses a custom indexer to process raw blockchain logs into market analytics. Its market-data pipeline processes activity automatically. This explains why a chart can exist without a person reviewing the token as an investment. Market activity and project descriptions also have different origins; a supplied description does not become a blockchain fact merely because it appears beside a chart.
Screening for markets without a token in mind
New Pairs, Gainers & Losers, and configurable screeners provide discovery paths when you do not have an address. Filters narrow the displayed set using measures such as volume, price change, liquidity, and market capitalization. Choose the measure that answers the immediate question: recent movement, trading activity, or available pool value. Sorting then orders the remaining results. A high position describes performance under that selection; changing the period or filter changes the comparison.
What does a rising chart tell you about trading activity?
A rising chart shows an increase in the displayed market price over the selected period. Its interpretation changes with the trades behind it. A sharp move during sparse trading carries different information from movement accompanied by sustained activity. The chart alone does not explain the traders’ motives or establish how easily another order could execute.
Candles summarize prices within intervals. Their opening, closing, high, and low values compress a sequence of trades into a small visual record. Changing the interval changes that compression, so a short burst can dominate one view and occupy little space in another. Keep the chart interval distinct from the reporting window used beside a volume or percentage-change figure.
Transaction counts and volume answer different questions. Counts describe how many trades occurred; volume describes their aggregate traded value. Many small trades can produce a larger count than a few substantial trades. Buy and sell counts alone therefore do not show the relative traded value on each side. Wallet activity also cannot, by itself, establish how many independent people participated.
Liquidity and valuation measure different quantities
Liquidity describes value held in the trading pool, while valuation applies a token price to a supply quantity. Market capitalization is therefore not a balance available to withdraw. A large valuation can coexist with limited pool liquidity. The reported liquidity figure also does not specify the execution price for an order of any size.
Dexscreener calculates fully diluted valuation by multiplying price by the difference between total supply and burned supply. FDV means fully diluted valuation. The displayed market capitalization often matches FDV, but eligible circulating-supply information can produce a different figure. For supply that remains unburned but outside circulation, the market-cap calculation can use self-reported circulating supply obtained through token-information sources.
These relationships explain why valuation, liquidity, and volume belong beside one another without becoming interchangeable. Valuation describes supply at a price. Liquidity describes the pool at a point in time. Volume describes activity over a period. An execution quote needs additional inputs, including order size and the pool’s pricing mechanics.
Does a trending position establish token quality?
A trending position reflects ranking inputs rather than establishing token quality or predicting returns. The Trending Score considers market activity, community engagement, token information, and security-related signals. Its exact weighting is not public. Page visits and reactions can contribute alongside trading measures, so the list expresses more than transaction activity alone.
Paid Boosts can temporarily increase a token’s Trending Score through a multiplier. They do not guarantee a leading position. Treat the Boost indicator as information about promotion when interpreting visibility; purchasing attention does not establish future demand. Advertising, ranking, and observed trading activity answer different questions, even when the interface presents them together.
Keeping selected markets in view
Watchlists retain markets you want to revisit, and price alerts support monitoring a chosen price condition. Neither function explains the cause of a price move.
Multicharts puts several charts in one view. Consistent intervals make visual comparisons easier to interpret, particularly when markets have different trading frequencies. A similar-looking pattern does not establish a shared cause. When comparing charts, retain each pair’s identity and quote denomination rather than relying only on its token label.
Theme groups add another discovery path
Metas group tokens around shared themes or narratives. Moderators and community members curate these categories, which differ from automatically processed market activity. A theme can help locate related tokens without implying shared ownership, technical design, or economic rights. Each constituent token still has its own markets and trading history.
Choosing between a chart and structured pair data
The browser interface supports visual inspection, while the API supplies structured records for software.
Visual inspection
Charts make timing and the shape of price movement easier to inspect. Screeners place markets beside one another for discovery, and saved selections reduce repeated searching. A visual view suits questions about how activity developed, provided the displayed period and pair remain clear. A screenshot captures only that view and moment; it does not preserve future changes.
Programmatic retrieval
The API supports pair searches, pool lookup by token address and chain, and retrieval by pair identifiers. Its records include fields for price, transactions, volume, liquidity, and valuation where available. An integration must preserve network and pair identifiers alongside those measurements. Endpoint-specific request limits also constrain polling frequency. Fetching more often does not change the underlying market or supply missing observations.
Where market analytics ends and another tool begins
A pair chart answers questions about the market it displays. A blockchain explorer serves a different task: examining transaction records, addresses, and contract activity. An exchange’s execution interface answers another question: what a particular trade would receive under its proposed route and conditions. These functions complement market analytics without making the displayed chart an executable quote.
Tracking activity requires an identified market and interpretable data. Placing a trade introduces transaction authorization, execution costs, and token-specific transfer conditions. A successful historical trade does not establish that every wallet can execute the same action under later conditions. When the question moves from observing a pair to executing an order, the relevant evidence changes with it.
Common questions
Do I need a wallet to read Dexscreener charts?
You can read public Dexscreener charts without connecting a wallet or signing a transaction. Token and pair addresses are search inputs, not requests to authorize spending. Reading analytics and granting an application permission to move assets are separate actions. A request for a recovery phrase has no role in looking up a public trading pair.
Is Dexscreener available on mobile?
Dexscreener has apps for iOS and Android. The mobile offering includes market charts and monitoring features, although individual functions can differ from the browser interface. Availability of the app does not establish identical controls or behavior across every device and operating-system version.
How are token descriptions and social links added?
Token information can populate automatically from external token lists, while Enhanced Token Info provides another route for supplying those details. This information is separate from the transactions used to generate market analytics. A description or social link concerns the token’s presentation; it does not establish ownership of a particular trading pool.
Does Dexscreener issue its own token?
Dexscreener does not have its own token. A token or presale claiming to represent the platform therefore conflicts with its stated token status. Sharing its name, logo, or appearance does not create that relationship, and appearing in a market-data listing does not establish one.
Why does an API record have a blank liquidity or market-cap field?
Some API fields permit null values, so a missing measurement does not mean the value is zero. Software should preserve the distinction between unavailable data and a reported zero. Replacing a blank field with zero can distort filters, comparisons, and calculations built from that record.